Report parameters
In one of the previous articles I wrote about how to use the slicers to filter out PowerPivot reports, and since recent update Power BI Desktop has the functionality to automatically configure these settings. Adding a new parameter creates an auxiliary table for filtering the visuals contained in the report. At the same time, a special slider with which we are filtering appears in the report.
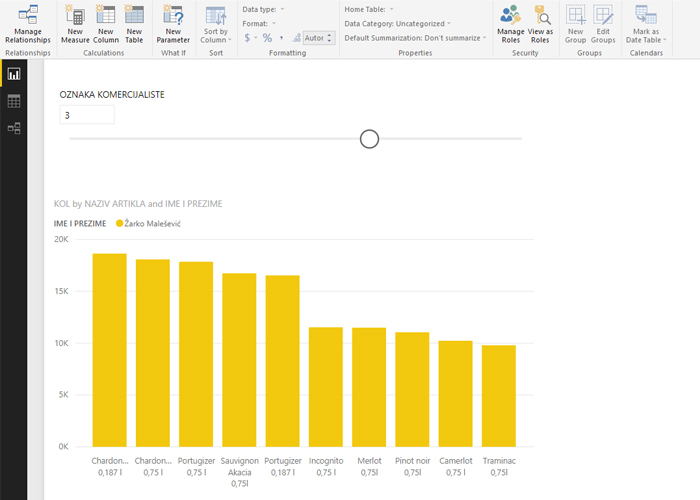
First we’ll add a visual to the report that we’ll filter later. Let it be a turnover in quantities in relation to the name of the article. Then we will click on the New Parameter button, after which a window will appear where we enter the name of the new parameter, the data type, the start and end value, the default value and the increment. By clicking OK, we confirm the creation of a parameter and the addition of a slider.
After this action we should connect parameter table to transactions and further add name of salesman to Legend field. Parameter slicer now can be used to filter the turnover report.