Decorating the Christmas tree

There is a time of Christmas holidays, the time when everybody, more or less, decorates the Christmas tree, and this served as an inspiration for the text on the application of one more type of Excel chart. It is a subtype of the Scatter called Bubble and by which we can get a “XY” chart whereby a multicolored “balls” are found on the section. To create this diagram all we need are: a table of data, a picture of the Christmas tree and a little work in Excel!

Speedometer

When analyzing key performance indicators (KPIs) for their display is often used a gauge that resembles a speedometer in a car. This is not a standard Excel chart. There are commercial add-ins used to create this type of chart that could be found on the Internet, but there is a technique to create it by combining and modifying the existing charts of Doughnut and Pie Chart.

Creating Gantt chart

Gantt chart s a chart type used to track project realization through phases, so we can see when the activity starts, how long it takes and when it finishes. It does not exist as a standard chart, but it can be created by modifying the Bar chart. In the following text, step by step, you will be able to find out how to create such report.

Chart templates

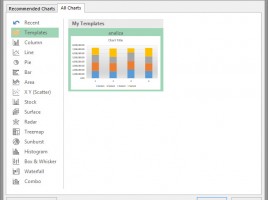
Companies often strive to unify their reports using predefined rules regarding choosing font types, color styles and other formatting modes. The unified look is introduced using Templates, and when we want to create charts, we will use chart templates. In addition to appearance, standard charts also introduce standard data ranges in axes, which contributes to the accuracy of the report.

Pivot charts

Pivot charts have almost all properties as standard charts that are used to visualize reporting data. They are specific in that they are always in relation to the Pivot table on the basis of which they were created or by some other data source (Data Model). Changing data in the Pivot table, e.g. by adding a new report dimension, the Pivot chart is automatically updated. You can find out more about Pivot Charts in the text that follows …