E-mail warning

When a customer is late with payment it would not be bad to send him an email alert. It is also a nice gesture if you thank him if he fulfills his obligations on time. All this can be done automatically from Excel, and the example you will be shown is the logical continuation of the previous post about the HYPERLINK function. Also, if you run your CRM in Excel, this is a good idea how to enrich it with some new functionalities.

Funnel chart

The Funnel chart is not a great novelty. In one of the earlier posts there were words about how to graphically represent the sales funnel, and what’s new is that this chart, that previously existed only in Office365 and Office Online editions, became part of Excel 2019. The Funnel chart is most useful when we want to display values ​​(quantities, amounts) in relation to a certain business phase, and how to do it will be shown in the following scenario.

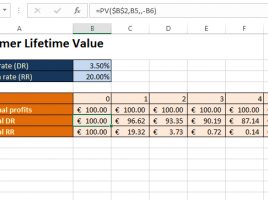
Customer lifetime value

The customer’s lifetime is the period in which we perform sales transactions, and the calculation of its value is a profit forecast based on the relationships that are mutually achievable. There are several ways to calculate it, and all of them show us profit flow that we can expect by retaining a customer. In other words, how much money comes if they pay regularly, if they are financed, and if a certain percentage of customers goes from year to year.

CRM

CRM (Customer Relationship Management) represents the concept of managing relationships with potential and existing clients, customers or consumers (depending on what and to whom we sell). Its task is to obtain new and retain existing clients. Although there are plenty of software that very well support the CRM concept, when you are a beginner in business you do not need anything more than Excel.

Sales funnel

In addition to my passion for Excel my great love, and partly my job, is Customer Relationship Management (CRM). One of the most important CRM charts for tracking sales is the Sales funnel. Every salesman likes to see it on his dashboard at the beginning of working day, because with one look he can conclude whether the sale is standing or advancing. Funnel does not exist as a standard chart. It is created by modifying the 3D Column chart, and how to do it you will find out in the text that follows …