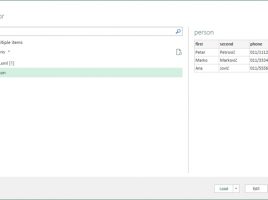
Pivot table bins

When we create a pivot table report, based on statistical data, it’s sometimes convenient to group them into bins so that we can analyze them more easily. In one simple case, where we research the age of the respondents and the answer to the question whether they are smokers or not, you will see how the groups (bins) are made and how can we later use them to create beautiful charts.

Pivot cache

The Pivot cache is automatically created each time you insert a Pivot table, and it is an object that replicates the data source based on which Pivot table is being made. Each time you need to change the look of the Pivot table, Excel automatically calls the cache, simply because it’s much faster – it handles local data, stored in the computer’s memory. However, what happens when a synchronization error occurs?

Filtering by lists

Slicers are great feature, but unfortunately they can not be used to filter traditional Excel reports. If we use the conditional aggregation functions, in order to calculate the desired values, as well as the data validation technique, we can make simple but effective filters by selecting the values from the list. By selecting the criteria from the list, the automatic update of the values in the report is performed. Let’s see how this works!

Parallel periods

The Power Pivot add-in allows you to make different calculations depending on the time period in which the sales occurred, by writing formulas in DAX language. To use these features you need to have one of the latest versions of Microsoft Office Pro Plus. Since many do not have this feature, it remains only to deal with the traditional lookup functions about which application I’ll write in following „recipe“.

C/S ratio

How good are the sales results? There are many indicators that can be used to control sales, and one of them is a C/S ratio. It represents the relationship between the contribution (aka difference in price, earnings, margin) and the amount of sales. By monitoring this indicator we can track change of earnings through time and that can show us how well a trade margin is formed.