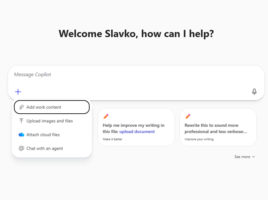
Microsoft Loop

Loop is  a web application within  the Microsoft 365 ecosystem designed to share ideas and collaborate on projects. For a long time, Word or Excel have provided the ability for multiple users to work on one document at the same time. Loop gives additional flexibility, such as sharing and collaboration from different applications. In this way, as soon as an idea is born, it can be written down, shared, commented on…

Microsoft Planner

Planner is a service for managing simple projects. It comes as part  of an Microsoft 365 subscription, and is reminiscent of tools like Jira or Trello. It is used to assign and track tasks within a team using the Kanban board interface, and is ideal for teams that manage task-based agile projects, where they can attach files, add comments, track progress through charts, etc.

Microsoft OneNote

OneNote is used to take notes. It comes as a free desktop app with Windows, but also as part of the Microsoft 365 suite or a web service. Notes are captured in notebooks, and each of them can have multiple sections and parts. In notes, we can write down text, keep To Do lists, add images, video or audio recordings, links… Notebooks are stored as documents in  the OneDrive repository, which means that notes can be easily accessed from any device.

Microsoft Viva

Microsoft Viva is a platform that aims to improve the employee experience, primarily in the Teams environment. It enables connection, provides better information, insights into the habits and workload of employees, gives better management of working time, facilitates learning… You’ve been able to implement these solutions before, using SharePoint, but Viva is far simpler and better integrated into  the Microsoft 365 ecosystem.

Microsoft Forms

Microsoft Forms is a web-based application for creating and sharing surveys, quizzes, tests, and other forms, allowing you to collect feedback from respondents and analyze the results in real time. The data we analyze can be easily exported to Excel, and if you know Power Query, you can process the results in a few steps to create effective reporting tables for their analysis.