Microsoft Viva

Microsoft Viva is a platform that aims to improve the employee experience, primarily in the Teams environment. It enables connection, provides better information, insights into the habits and workload of employees, gives better management of working time, facilitates learning… You’ve been able to implement these solutions before, using SharePoint, but Viva is far simpler and better integrated into  the Microsoft 365 ecosystem.

Microsoft Forms

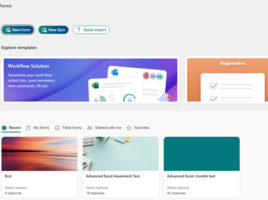
Microsoft Forms is a web-based application for creating and sharing surveys, quizzes, tests, and other forms, allowing you to collect feedback from respondents and analyze the results in real time. The data we analyze can be easily exported to Excel, and if you know Power Query, you can process the results in a few steps to create effective reporting tables for their analysis.

Adjustable display units in report

When we create a sales report, sometimes we want to show the values in their original form, and sometimes they can be recalculated values, such as thousands or millions. Such a report is created in a very simple way using the Data Validation option, which allows you to select the desired unit size, and recalculate values with help of the Excel LAMBDA function. Let’s create a report like this with a chart to visualize the data.

Advanced data grouping

In one of the previous “recipes” we talked about how to use the Excel GROUPBY function. On that occasion, you could find out how to use it in one of the standard scenarios of its application, and now you will learn how to use it in a slightly more advanced way. To begin with, how you can group by two or more dimensions, and then how to display percentages, determine the depth of the calculation, and so on.

Sales overview in selected currency

When creating business reports, there is often a requirement that they should be displayed in multiple currencies, that is, the user can choose the currency in which a report is displayed. This can be achieved in several ways and one of them, very elegant, is with the help of the LAMBDA function. In this “recipe” you will find out how you can use it to display sales reports in different currencies.