LET function

The LET command exists in several programming languages ​​and is used to assign values ​​to variables. In a similar way in Excel, you can declare one or more variables, assign values ​​to them, and define the expression in which they are used using the LET function. This is especially beneficial when there are parts within the formula that are repeated several times. The LET function, in addition to shortening the formula, also significantly affects the performance …

Funnel chart

The Funnel chart is not a great novelty. In one of the earlier posts there were words about how to graphically represent the sales funnel, and what’s new is that this chart, that previously existed only in Office365 and Office Online editions, became part of Excel 2019. The Funnel chart is most useful when we want to display values ​​(quantities, amounts) in relation to a certain business phase, and how to do it will be shown in the following scenario.

Functions IFS and SWITCH

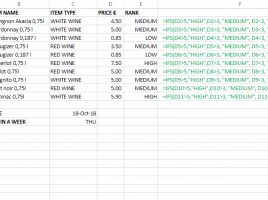
Excel that comes with Office365 brings two new logical functions: IFS and SWITCH. The first of them consists of a number of conditions, and returns the selected value after the first fulfilled condition. The other starts with a condition, and then, depending on the values ​​that meet the requirement returns appropriate value. Sometimes these functions can be very useful, and how to use them I’ll show in following recipe.

Power BI dashboards

In a previous “recipe” you’ve met PowerBI work environment and ways to create reports and dashboards. In the following post I will introduce you to the featured dashboards, favorites, groups and workspaces, display and filtering the content that appears in the menu. Also, there will be words and the additional options to edit, add content and share dashboards. Most of these options can be used in the free variant PowerBI service.

Data model

Data model is used to add and connect tables in a whole, in order to retrieve the data needed for reporting. This is a pseudo-base, part of Excel document. By adding a table into the Model data are automatically compressed; later, when we need them for reporting, they are decompressed and used as a reporting dimension in the pivot table. Data model is basis for use of “Power” technologies, i.e. “self-service” business intelligence tools.