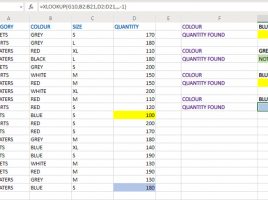
Filtering charts
Filtering affects the appearance of a report by setting certain criteria. If we create a pivot chart, it will be formed based on the data from the pivot table. If we change something in it, the chart will also change. Is this possible to do in traditional Excel reports? Yes, if you have an Office 2021 or Office 365 subscription, with the new XLOOKUP function. This is a simple method by which you can get effective reports.