
Sales volume in relation to the goal
Sales volume in relation to a given target can be shown by a goal achievement chart. There is another way to do this, and that is to display real sales values instead of moving the intersections of the x and y axes, using a Combo chart in which the target would be a horizontal line based on the data in the table. Also, by adding the Spin Button control, we will be able to change a goal easily, which leads to the dynamic chart.
We will start from a simple table in which the first two columns are the names of the months and the amount of sales. Then we add a column with sales targets. We fill it based on the cell whose contents we will change later when we move the target. The difference column is the one that contains the difference between the target and the achieved values. We will use the last three columns to show the series themselves. They in turn contain formulas that determine how the data will be displayed. If the difference is greater than or equal to zero, the value of the first series is 0; otherwise the value of the series is reduced by the difference. The second series shows the difference, while the third shows values that exceed the target.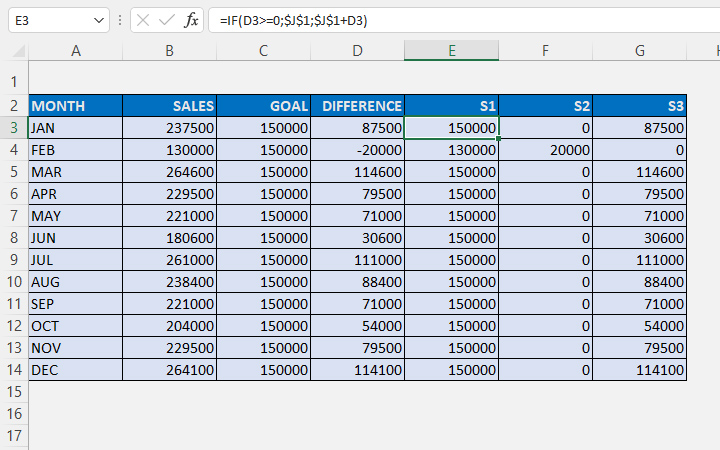
Based on the first column, which contains the names of the months, as well as columns S1, S2 and S3, we will create a Stacked Column chart. The color of the S1 series should be blue, the S2 series should be transparent, and the S3 series should be shown in green. Then, we change the chart to Combo and add another series – a horizontal yellow line indicating the target. We will set the values of the y axis to be expressed in thousands of dinars. Next, we continue to edit the layout of the chart according to preferences …
When we get the chart we want we add Spin Button control. We will connect it to a cell, and then we will enter the address of the connected cell multiplied by 1000 in the cell that contains the target. With each subsequent click on the control, by the arrow-down we decrease and by the arrow-up increase the target. This way we got a dynamic chart.