Illustrate your report

Icons are illustrations that we first encountered when Office 2019 appeared. Although we could find a multitude of icons, divided by categories, Office 2021 has significantly improved this segment so that now, in addition to a rich icon gallery, you can add images, transparent photos of people, stickers, or other vector images that can enhance the look of your report. Let’s see how this is used!

Compressing pictures

“A picture speaks more than 1000 words” so you leave a better impression when you enrich the report with pictures. However, many users do not care how big they are and, accordingly, Excel files grow progressively. Even Office 2010 got an option for image optimization that you can use whether you use Word, Excel, PowerPoint … Optimization reduces images, which loses quality, but files take up less space. How to determine the right ratio?

Header of Data tables

Structured tables (Data tables) or, as we call them, named ranges represent a group of cells that have been given a name and a filter to make it easier to view and work with the data they contain. If these tables start from the first cell in the worksheet, you can set the cell header to appear instead of the worksheet header. To be more precise, instead name of the columns they contain.

Traffic lights

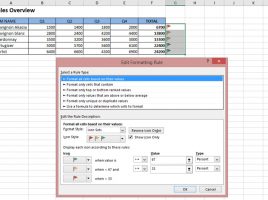
Conditional formatting is an Excel functionality that is often used, and allows you to emphasize certain parts of the report. Typically, conditional formatting is used within the same column, but how do we display “traffic lights“, icons that indicate a change in business, within another column? This is a very simple procedure, and if you want to find out how this is done, you have it in this “recipe”.

Up to date slicers

Pivot tables often store data in the cache, and some of that data is also that about slicer elements. Slicers take values ​​from the source table. If we add some of them and then delete them, it may happen that the slicers show phantom values. They are shown in pale color, as if there is no data. And indeed, if we pick such a value, we will get an empty pivot table report. How can slicer elements always be up to date?