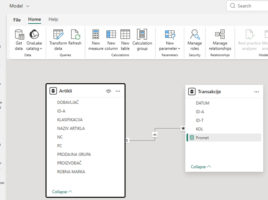
Displaying details

Power BI visualizations often have a Tooltip section with which is a feature that enables focus on specific attributes. For example, if you hover an item shown in the report, you can see information about the manufacturer, number of brands, average price, etc. Something like this does not exist in Excel, but if we can mark items in some way, it is possible, with a little improvisation,  affect the display of attributes. To do this, we will use the Checkbox option…

TRANSLATE function

Translation in Excel documents is not a new feature, and with the advent of artificial intelligence, it works incomparably better than before and can be said to be competitive with the Google Translate service. Recently, we also got a TRANSLATE function that translates text from one language to another, and allows you to create reports that are dynamically translated.

Focusing on content

Excel has recently gained several new features that make it easier to focus on the content, i.e. the tables we work with. First, the menu with color palettes is now much larger and more noticeable, and the choice of colors is more adapted to visually impaired people or those who do not perceive the differences between colors well. Then there is a new option that allows you to focus on the cell, making it easier to work with large tables.

Excel and Microsoft Forms service

Everyone knows that at the end of the year I often post “recipes” that have something to do with the Christmas and New Year holidays. This time I decided to show you how to combine Excel and Microsoft Forms, a Microsoft 365 service used to create questionnaires, quizzes, polls… In this text, you will find out how to create a New Year’s questionnaire by creating a form directly from Excel.

Function PIVOTBY

Pivot tables have been with us for a long time and allow us to easily analyze data by changing the perspective from which we look at them. Recently, there is also a PIVOTBY function that allows us to get a similar report, but in an Excel spreadsheet. By marking rows, columns, values ​​and other parameters, a dynamic report is generated. Here’s a post about how to use this function…