
Power Pivot
Power Pivot is an interactive tabular report, similar to traditional Pivot table, from which it differs in that it is based on tables that belong to the Data model. It can handle large amount of data that are unpacked when needed, when we have to use them in report, thus saving memory space. It has several specific options, such as KPI, hierarchies or data sets, which can be very helpful when we are making complex reports.
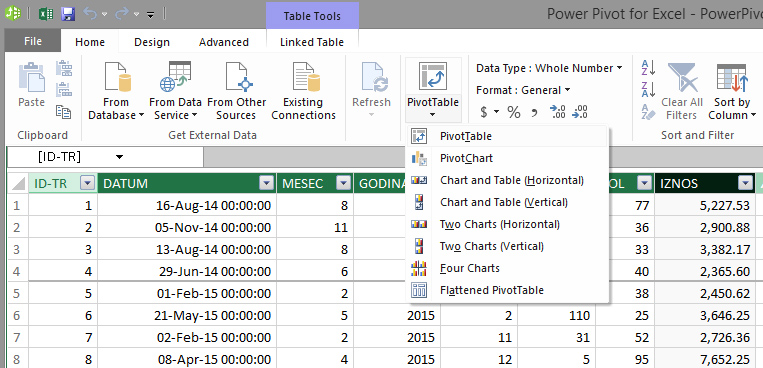
Let’s create Power Pivot report! After we added tables in the Data model and made relationships between them, within Home ribbon we can find menu called Pivot table. Opening the menu we will be offered several varieties of Power Pivot report, from classical Power Pivot to different combinations of reports and charts or independent charts. Let us select the first option – Pivot Table. After this selection a dialog window will appear and offer us a choice where to put a report: in a new worksheet or to location in one of the existing worksheets. We will choose the first option and create a Pivot table. It is important to note that the report is created based on a table in within the Model in which we find ourselves at the moment of creation.
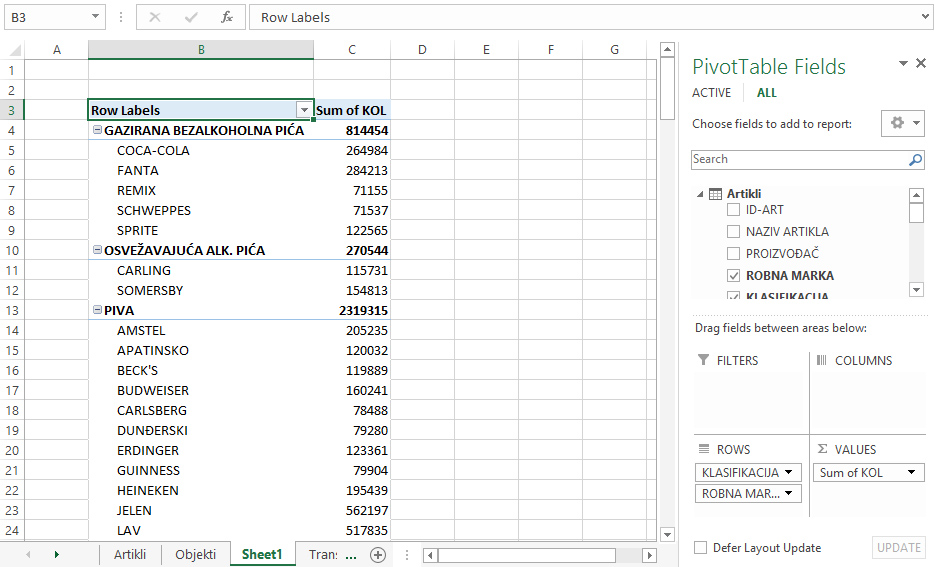
We got a report that is similar to the traditional Pivot table. On the right side is a panel named Pivot Table Fields where we can see the reporting dimensions, as well as field areas: Values, Rows, Columns and Filters.. We can easily see which reporting dimensions belongs to which table in the Model, as reporting dimensions are grouped by tables. At the top of the menu we can see the two cards to see the active (Active) or all the tables in the report (All). When we make reports on the basis of large number of tables this option can be useful to us. At the bottom of the control panel there is an option Defer Layout Update. It can be very useful when working with reports that are filled with large amount of data. Its enables us to update a Pivot table, after coating dimensions in rows, columns or filters, as well as when you add new data aggregation, by hand, by clicking Update. This operation can save us a lot of time when we’re dealing with complex datasets..
In the same manner as with traditional Pivot table, two context ribbons will appear: Analyze and Design. They have the very same options that we encountered when creating a pivot table, and some specific options that I’ll be talking about in texts that follow …