Pivot table as data source

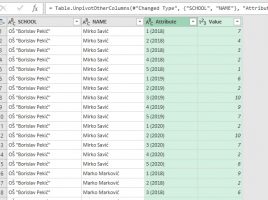
Pivot tables are reports that, above all, are used to interpret data based on given criteria. Sometimes a pivot table can also be used as a data source to make one or more new pivot tables. This usually happens when you want to create a pivot table from an existing business report, based on a query to the transaction database, and thus use the data that are available in initial pivot table.

Solve Order

Calculated Items allow you to create formulas based on arithmetic operations between elements in rows and/or columns within a pivot table. Sometimes Excel can get confused and display incorrect results due to a misinterpretation of the order of computational operations. Solve order is an option with which we can change the order to get the correct result.

Customizing source table

Before you decide to create a pivot table, ask yourself: do you really need it? This report groups and aggregates data (summation, averaging, counting, etc.) and you may have already done so in the source table; maybe it is, in itself, a report? If you do decide to take this step, you will need to adjust it so that the pivot table can process the data, because it requires that the records be in rows.

Up to date slicers

Pivot tables often store data in the cache, and some of that data is also that about slicer elements. Slicers take values ​​from the source table. If we add some of them and then delete them, it may happen that the slicers show phantom values. They are shown in pale color, as if there is no data. And indeed, if we pick such a value, we will get an empty pivot table report. How can slicer elements always be up to date?

Show the values row

When we add dimensions to the Pivot table, columns in the report are filled in sequentially. If we use a different report layout than the Compact View, each report dimension will occupy one column, and then all columns in which the data aggregation is performed will be displayed. There is one setting within the pivot table options that allows us to differentiate values ​​(the data we aggregate) from reporting dimensions.